AI in Healthcare · Performance Metrics
Rare diseases expose the hardest truth about AI model scores. When only 3 patients in 100 have the condition, a model that predicts negative for everyone is 97% accurate — and clinically useless. The metrics that matter in rare disease AI are not the ones most people report first.
The four metrics, plainly stated
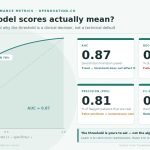
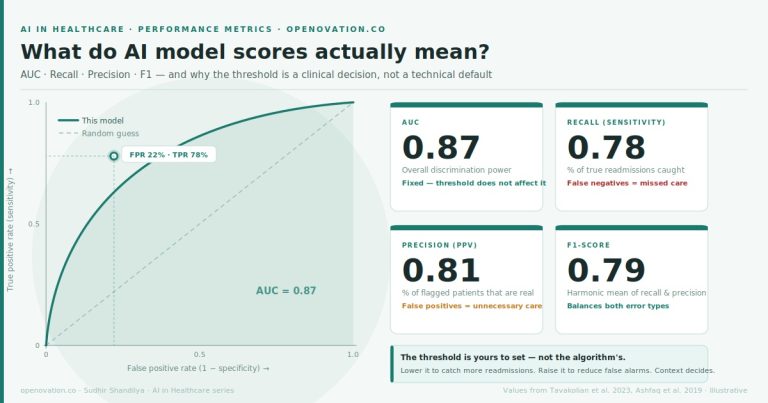
AUC (Area Under the Curve) measures how well the model ranks patients by risk. An AUC of 0.87 means: if you randomly pick one patient who has the condition and one who does not, the model correctly identifies the higher-risk patient 87 times out of 100. It does not tell you how many patients to flag — and it does not tell you whether the model is actually useful in a rare disease context.
Recall (Sensitivity) is the percentage of true cases the model catches. In rare disease, this is the metric that determines whether patients escape a 5–10 year diagnostic odyssey or are identified early. High recall means fewer missed diagnoses.
Precision (Positive Predictive Value) is the percentage of flagged patients who actually have the condition. In rare disease, where prevalence is low, precision is almost always the harder metric — the model will flag many false alarms for every real case, because real cases are scarce.
F1-score is the harmonic mean of recall and precision: F1 = 2 × (Precision × Recall) / (Precision + Recall). In rare disease, F1 is more honest than accuracy. It cannot be gamed by a model that simply predicts negative for everyone. Both recall and precision must be strong for F1 to be strong.
What is a risk threshold — and who actually sets it?
The AI model assigns every patient a risk score from 0 to 1. The threshold is the cutoff you choose: patients above it get flagged for further workup, patients below it do not.
In rare disease, this dial is especially consequential. The condition is already rare — so any threshold that is too high will miss almost every real case. But a threshold that is too low will flood the system with false alarms, triggering expensive or invasive follow-up for patients who do not have the disease.
The threshold is not a technical default. It is a clinical policy decision shaped by the severity of a missed diagnosis, the cost and risk of the confirmatory procedure, and how much diagnostic bandwidth your team can absorb.
Choose a clinical scenario
Gaucher disease
Acute kidney injury
Prevalence: ~3.5% in a referred dyspnea population · Humbert et al. ESC/ERS Guidelines 2022
Drag the threshold — watch what changes
| 30 flag more patients ← |
AUC
0.87
Discrimination power
threshold has no effect
Recall
0.89
% of true cases caught
Precision (PPV)
0.54
% of flags that are real
F1-score
0.67
Balance of both
Confusion matrix — 1,000 patients, 35 with PAH
| Predicted positive | Predicted negative | |
| Actual positive |
31TP — caught | 4FN — missed |
| Actual negative |
26FP — false alarm | 939TN — correctly clear |
4
Progressive right heart failure — median survival ~2.8 years untreated; each year of diagnostic delay worsens prognosis and treatment response
26
Unnecessary right heart catheterization — invasive, ~0.1% serious complication rate, significant patient anxiety and cost
PAH is a textbook rare disease AI problem. Even in a high-risk referral clinic, only ~3.5% of patients have the disease. Precision will always be hard. The clinical question is: how many invasive catheterizations are you willing to perform to avoid missing one diagnosis?
The bottom line
In rare disease, the class imbalance is extreme by definition. A model that achieves 97% accuracy by predicting negative for everyone has failed — it has simply learned the prevalence. F1-score exists precisely to expose this failure. Recall and precision must both be reported, and the threshold must be set by clinicians who understand what a missed diagnosis costs and what an unnecessary confirmatory procedure costs.
AUC tells you how good the model’s underlying discrimination is. Threshold tells you how you choose to deploy it. In rare disease, both questions are harder than they look.
PAH metrics: Humbert et al. ESC/ERS Guidelines 2022 · Gaucher disease diagnostic odyssey: Mistry et al. Am J Hematol 2019 · AKI detection: Tomasev et al. Nature 2019 · Widget values are illustrative for teaching purposes · openovation.co